Culture & Conduct Risk Regulatory Landscape
Culture & Conduct Risk Regulatory Landscape
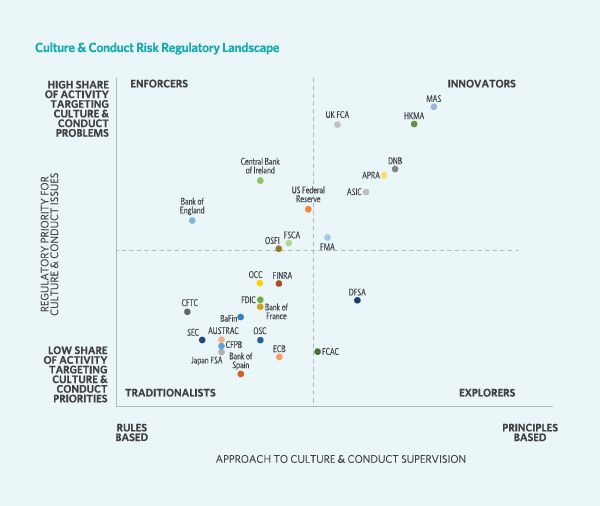
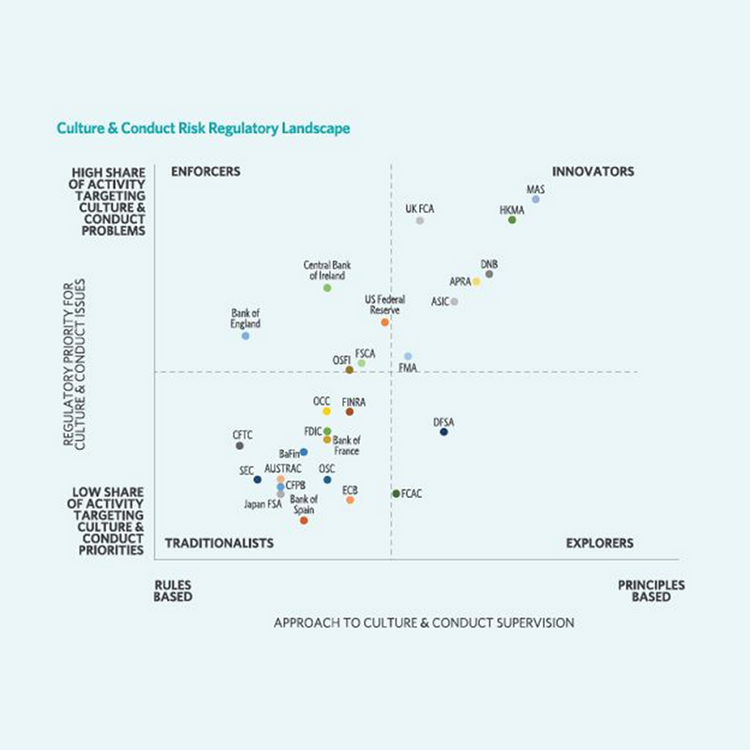
For the second year, Starling offers its Culture and Conduct Risk Regulatory Landscape chart. The Landscape provides a means to compare the various strategies and approaches the global regulatory community has taken with respect to the supervision of Culture and Conduct Risk.
The X-axis describes the relative strategies regulators have taken to the regulation of Culture and Conduct risks and whether those strategies tend more towards a Rules-based vs. a Principles-based approach.
The Y-axis reflects the relative prioritization of programs and activities targeting culture and conduct risk vs other supervisory priorities. This does not necessarily reflect total resource commitments. Rather, this measure captures each regulator's relative mix and range of activities and programs that are designed to support a Culture and Conduct agenda.
In producing this chart, we relied on responses to our annual Survey which we complemented with regulatory announcements, speeches, and other public information. As such, this analysis does not reflect any guidance regulators may have issued privately.
Our goal is not to make value judgements as to which approach is most effective. There are numerous factors that influence regulatory approaches which go beyond the scope of this exercise. Rather, our intent is to represent how various regulatory and supervisory bodies have positioned themselves publicly in an effort to identify forward-oriented
trends. lt is appropriate to assume that current events and politics will drive changes to the regulatory stances reflected herein.
As the industry evolves, as regulators roll out new initiatives, and as new information becomes available to us, we will of course incorporate those developments into future updates to this chart. Readers may have suggestions as to how we might improve on this current work and, if so, we encourage you to be in touch. Please write us at
[email protected].